Lapp_Portfolio
Final Project Walkthrough - Spatial Data Science Heinz CMU 2024
A Proximity Point of Interest Routing Website for the ‘ChiTech Innovate Expo’
By: Colton Lapp // Spring 2024
Github Repo: Link
Project Overview
Setting: A multi-day tech conference in September 2024 is hosted by the City of Chicago. The city hopes to provide a seemless and impressive experience for visitors by building a dedicated webpage for expo atendees
Goal: Develop a website that dynamically routes individual’s to upcoming expo events and highlights local amenities
Deliverable: Python code that utilizes the cities database of events to dynamically route an individual to nearby events given their location and the time of day, highlighting points of interest and the city character in an interactive web map
Environment: The expo events and their associated conference centers are saved in a PostgreSQL database. The city has requested that an open source solution be developed which will integrate with existing systems.
Demo:
Tools Used:
- PostgreSQL / PostGIS - storage of geospatial datasets
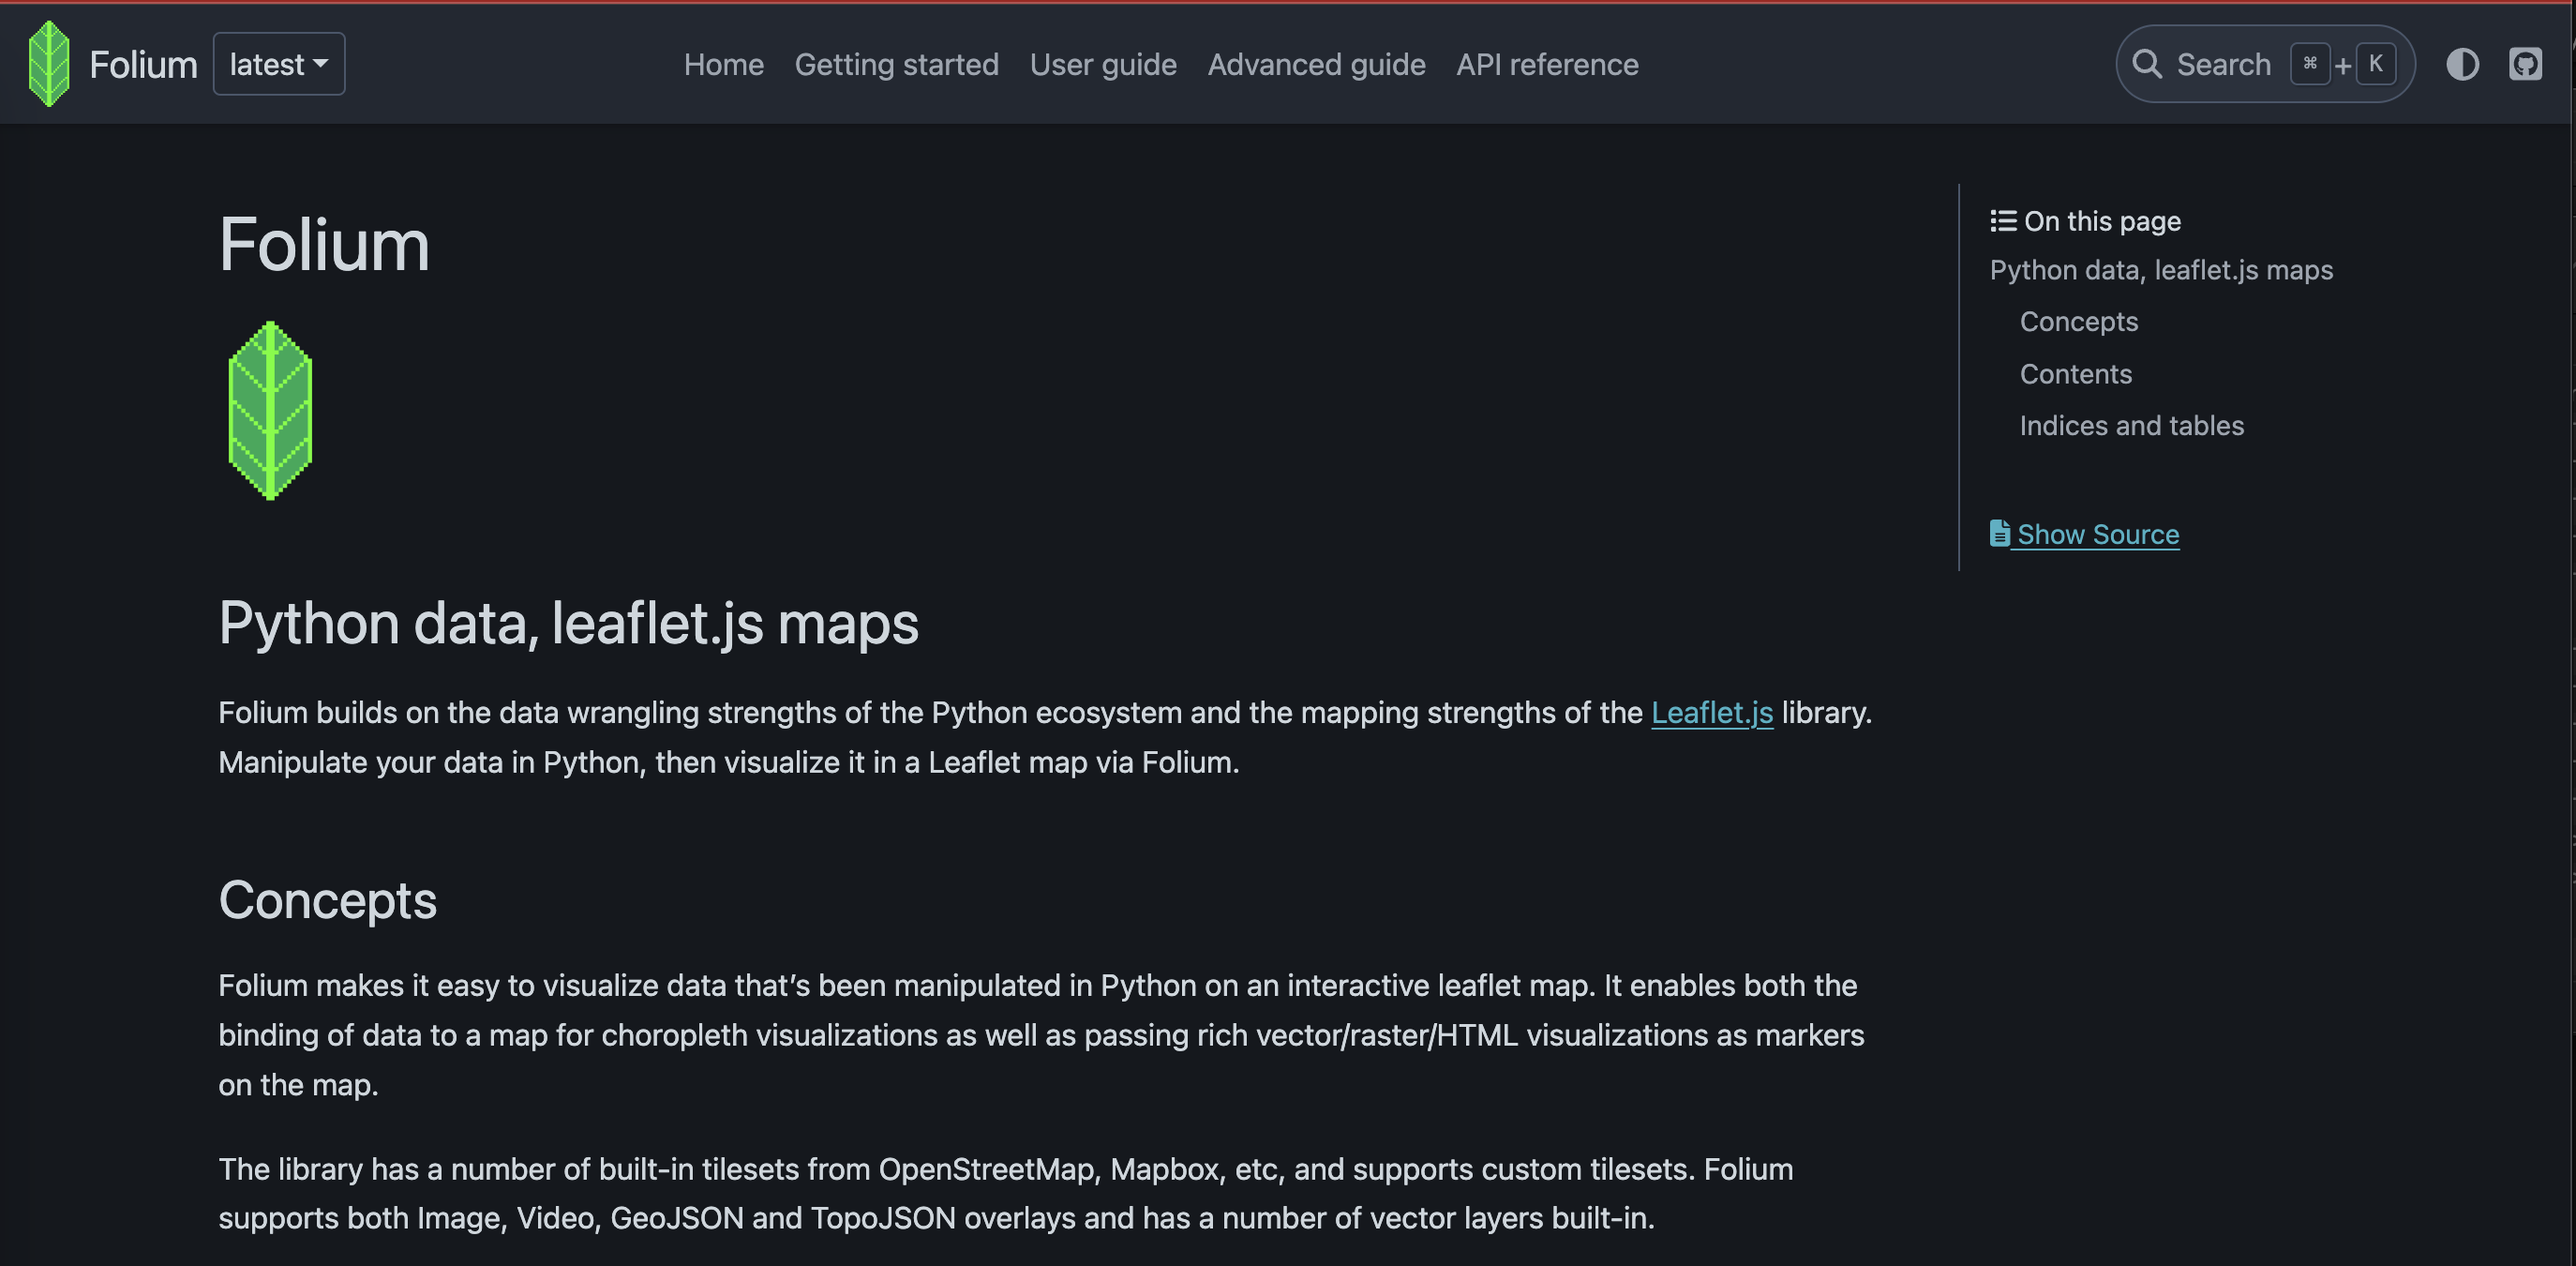
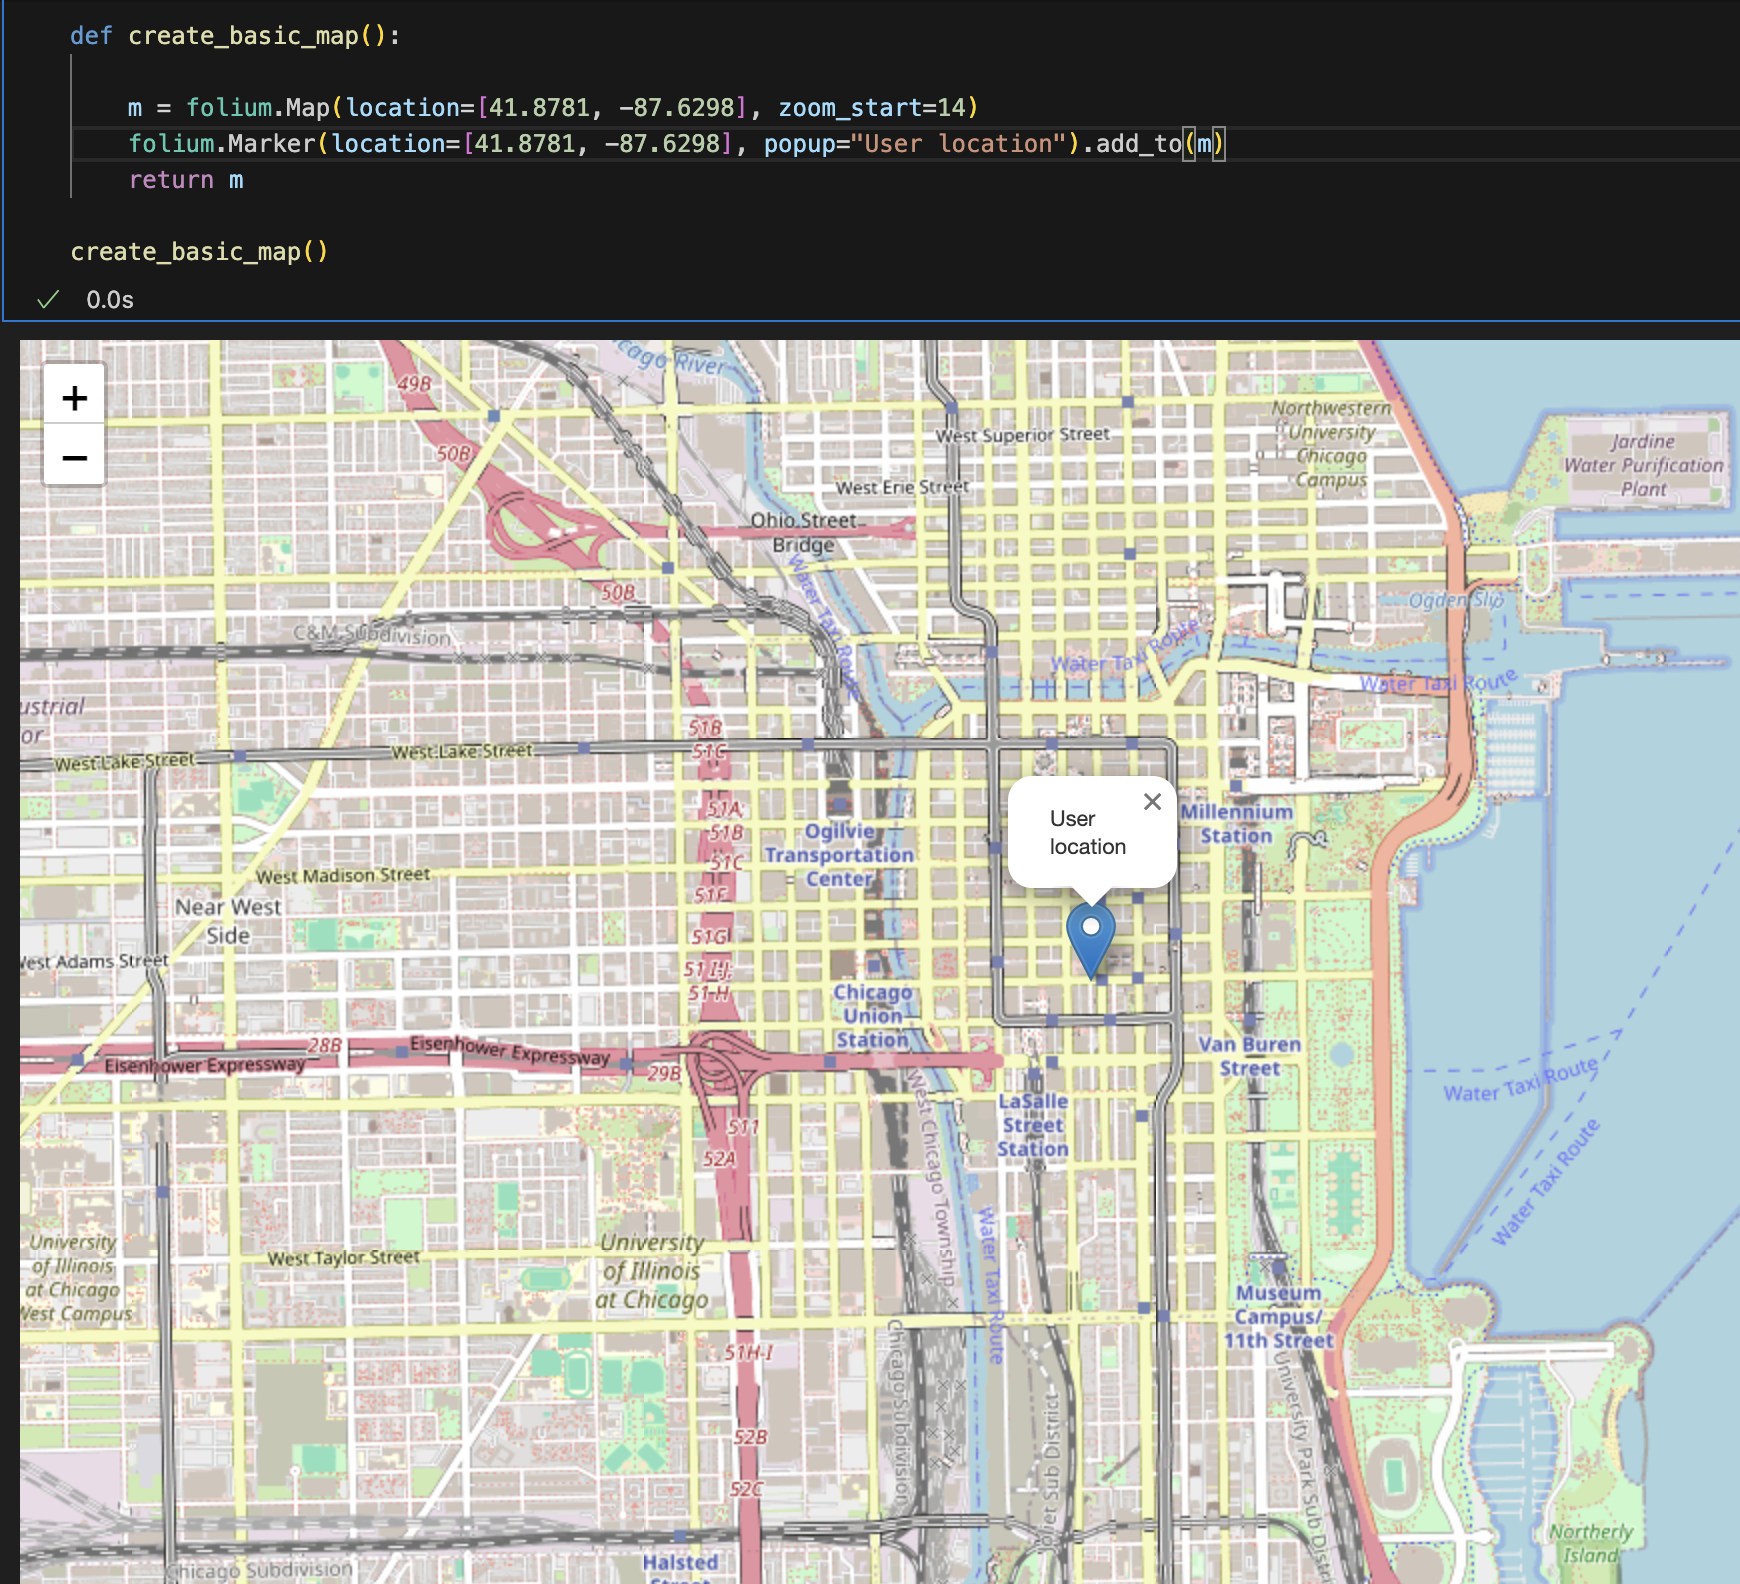
- Folium (Python package) - creation of .html web maps
- Geopands / Shapely (Python packages) - Geospatial analysis of geometries
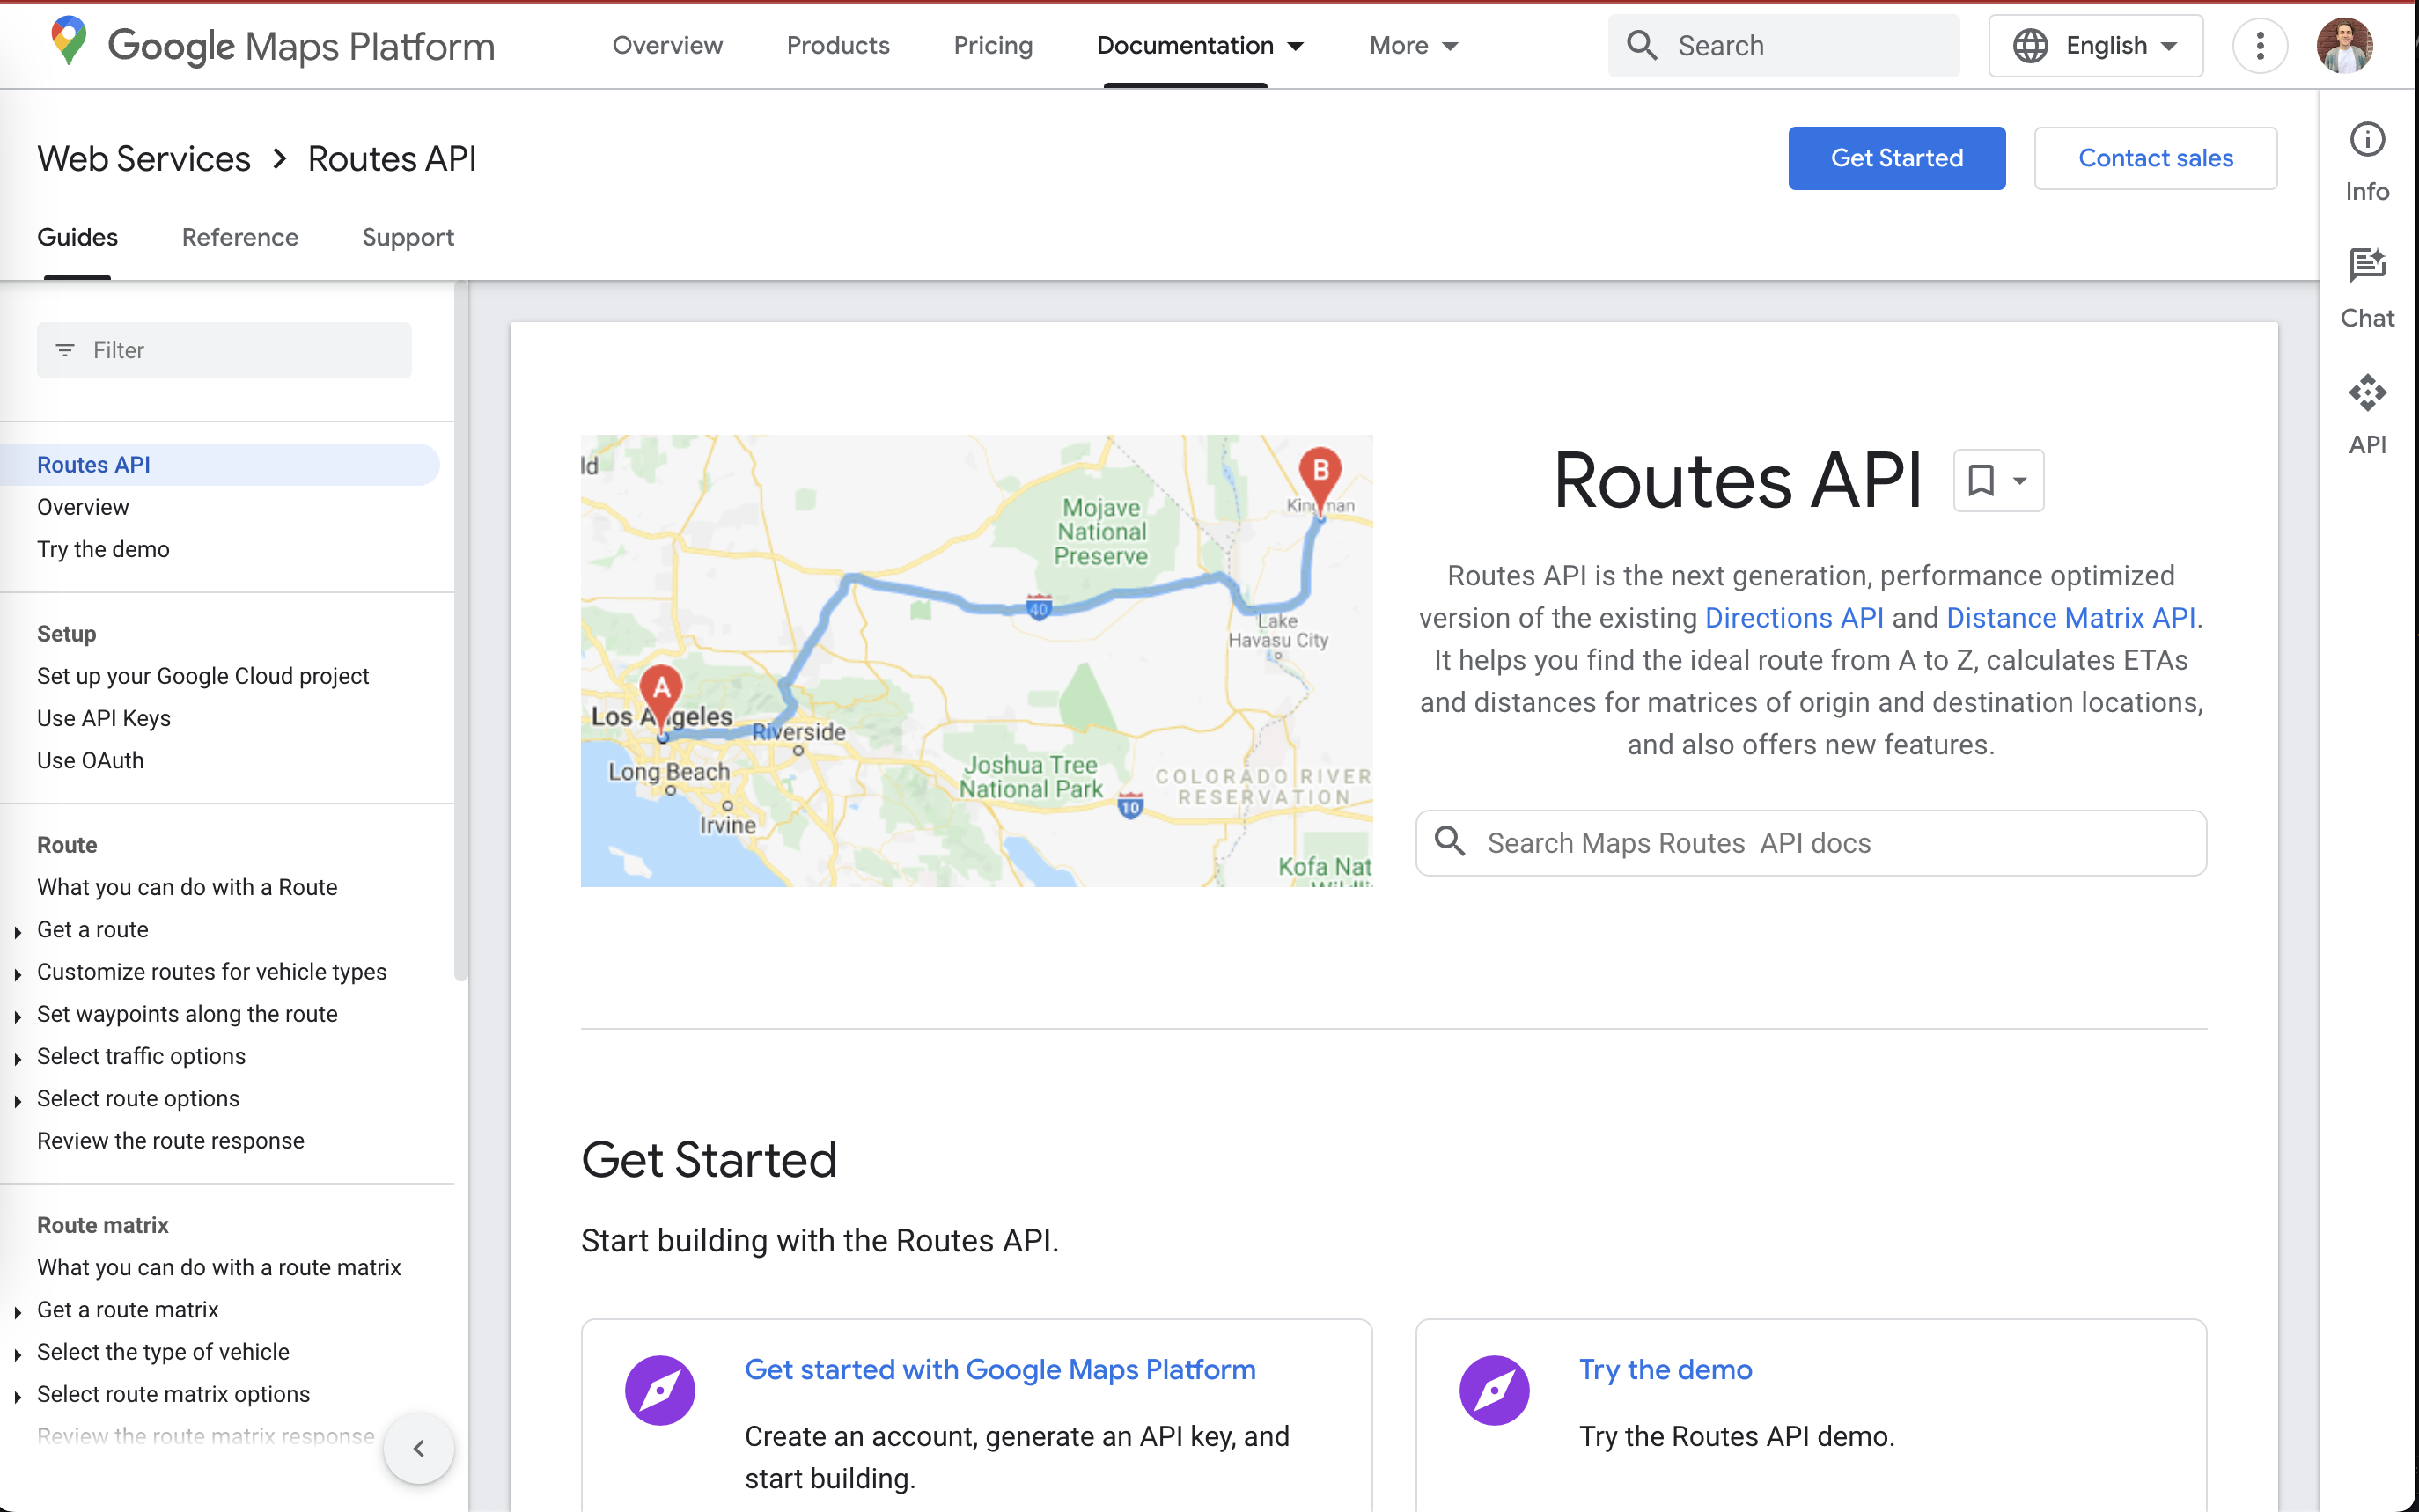
- Google Maps API - Used to retrieve routing directions
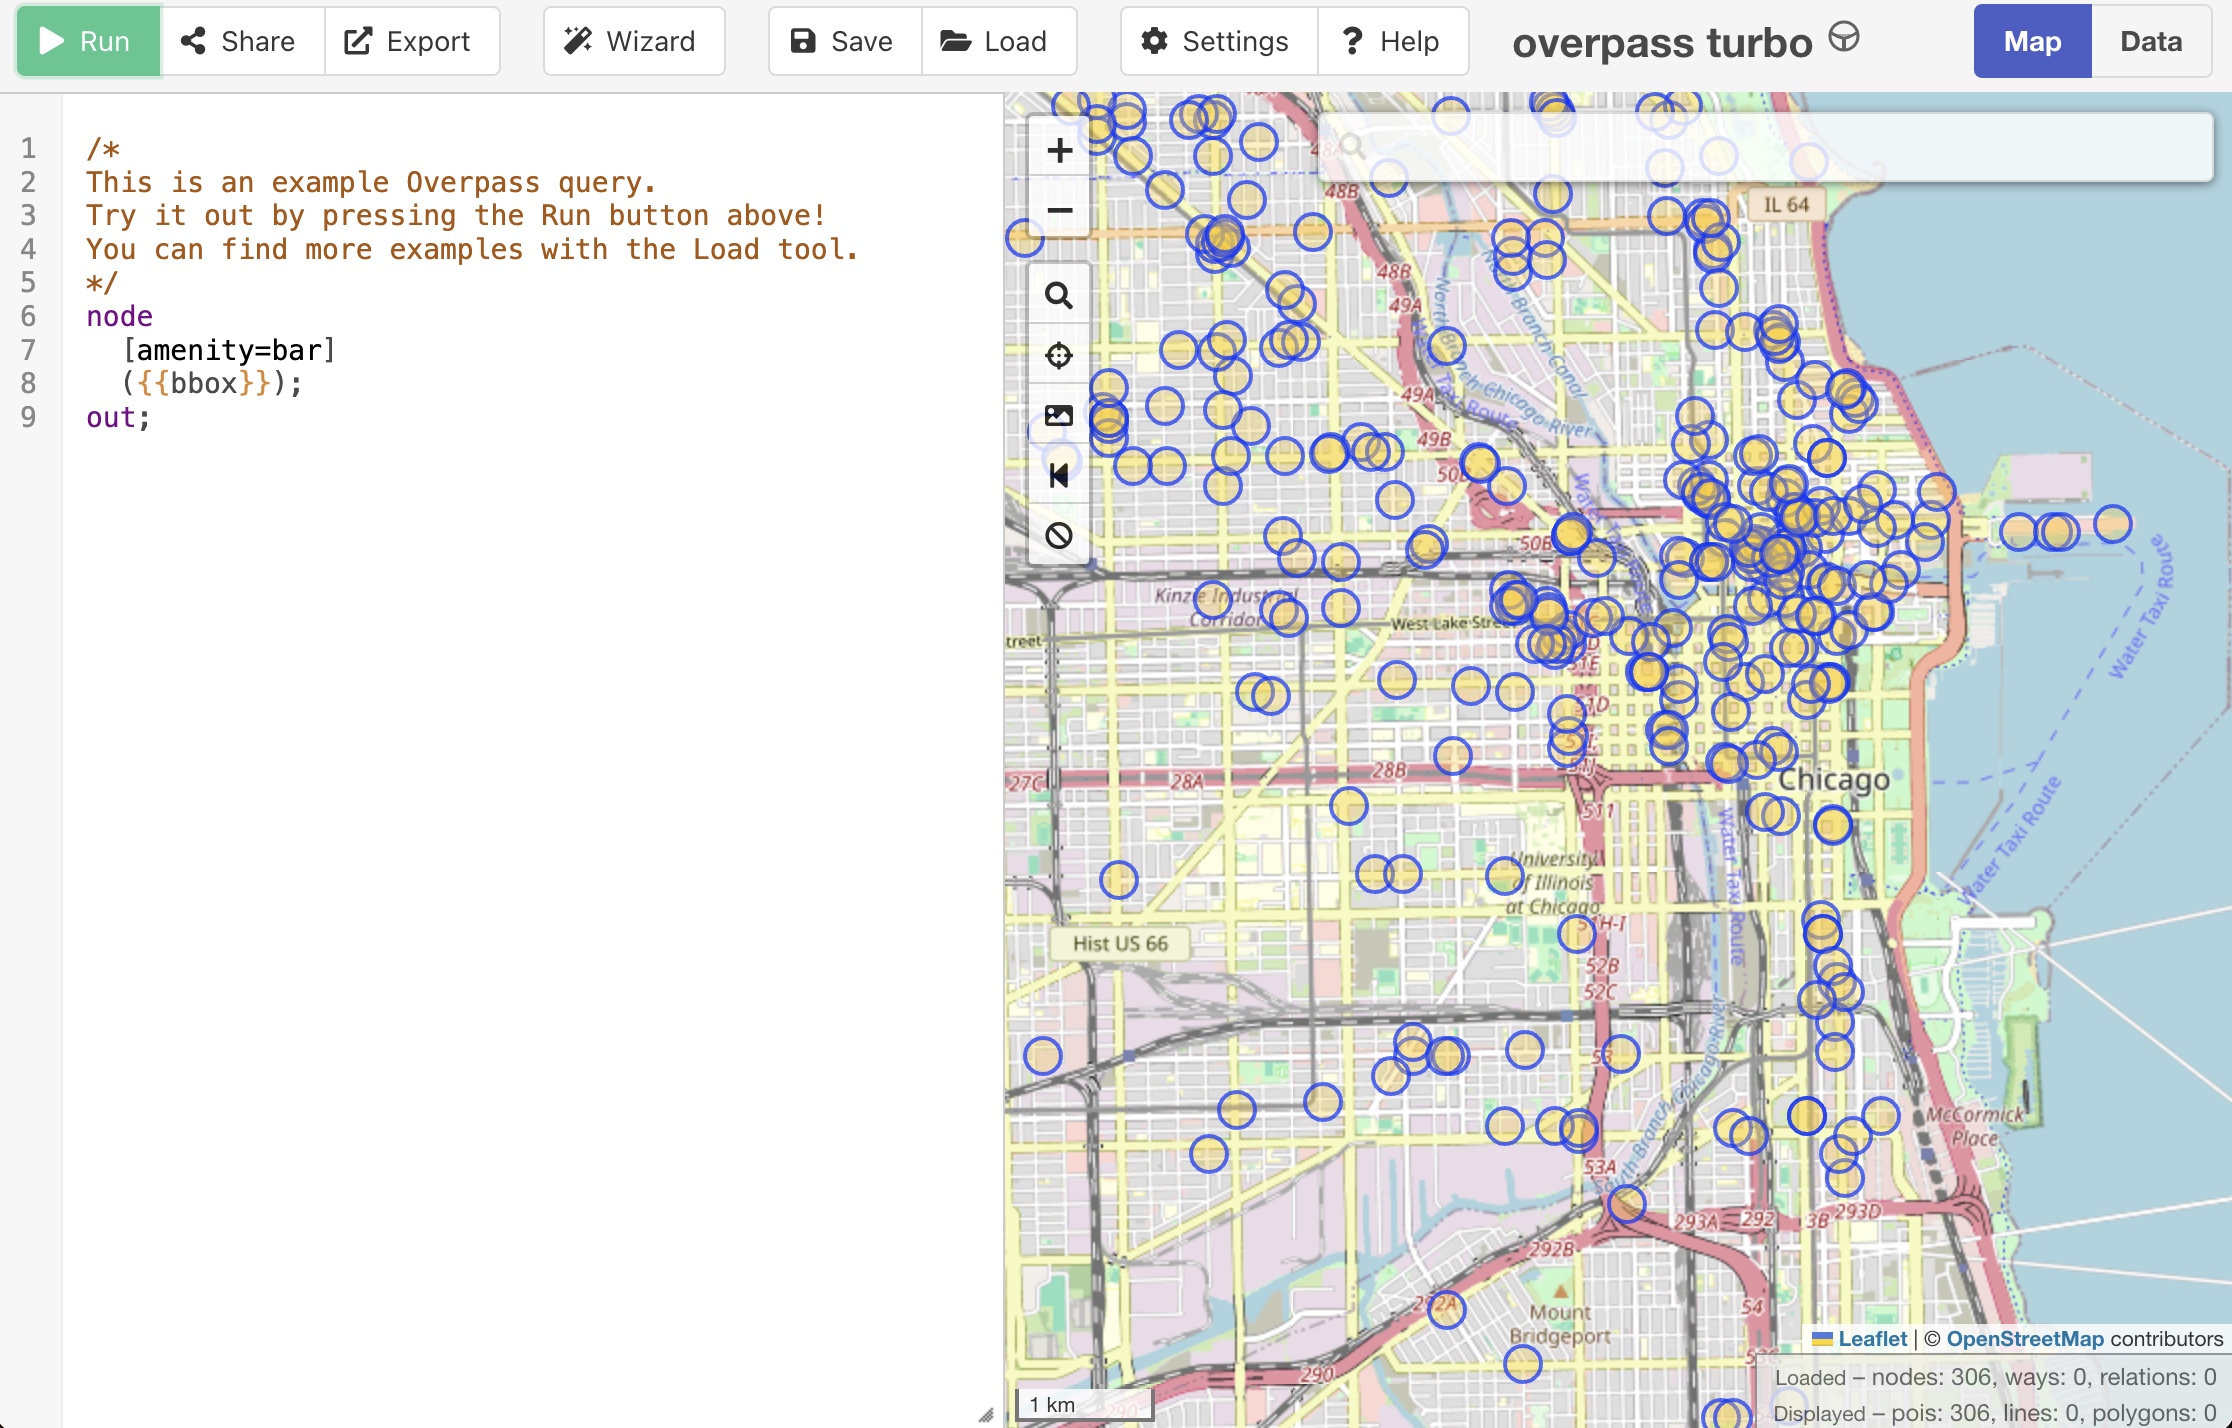
- Open Street Map - Scraped and saved points of interest, including bars, restaurants, cafes, and more
- Flask (Python package) - Used to build a website to generate and display the dyhamically created web maps
- QGIS - Used for exploratory data analysis of event spaces and for data loading
- ChatGPT / DALLE - Used to create logos, create fake event data, and for code assistance
Procedure:
Created and Retrieved Data
- Scraped lat/lon and venue names for conference centers in Downtown Chicago from Google Maps
- Created fake tech event data in .csv format in ChatGPT
- Scraped and cleaned all point of interest data in Downtown Chicago from open street maps using a Python script
- Wrote Python function to create random location and time
- Downloaded Chicago shapefiles (streets, water, parks, neighborhoods) from public websites
- Generated logos using image generators
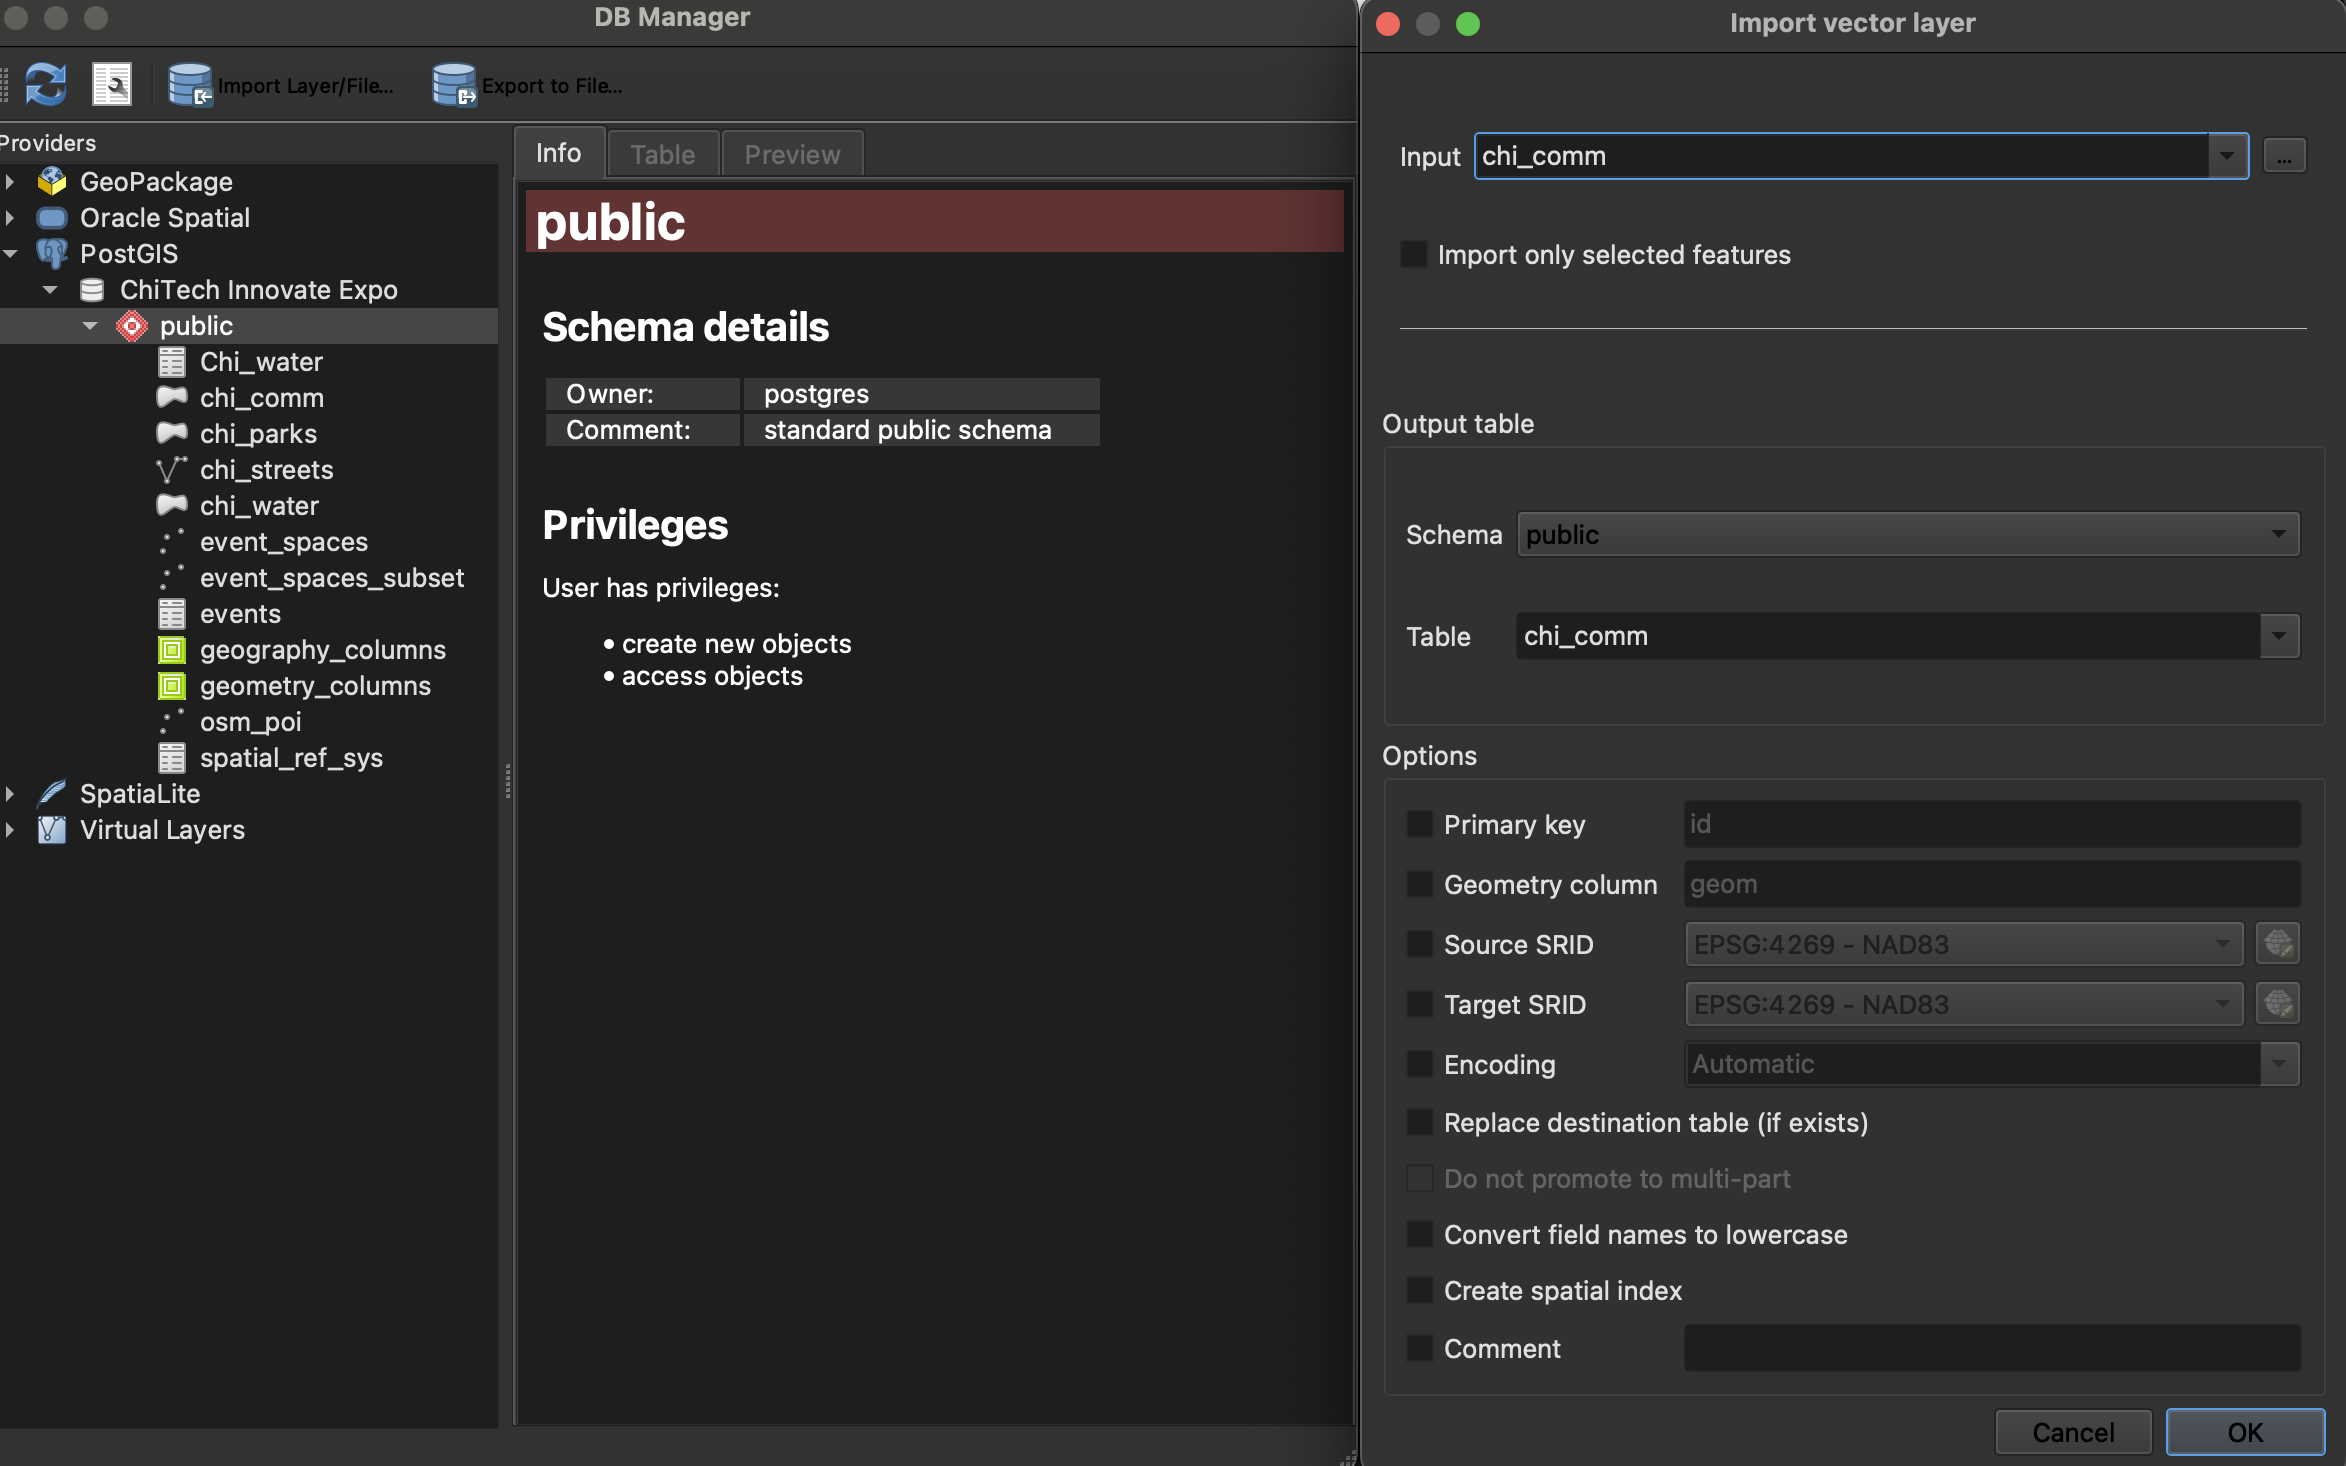
Created PostgreSQL database and saved datasets
- Used QGIS to load geospatial datasets into custom PostgreSQL database
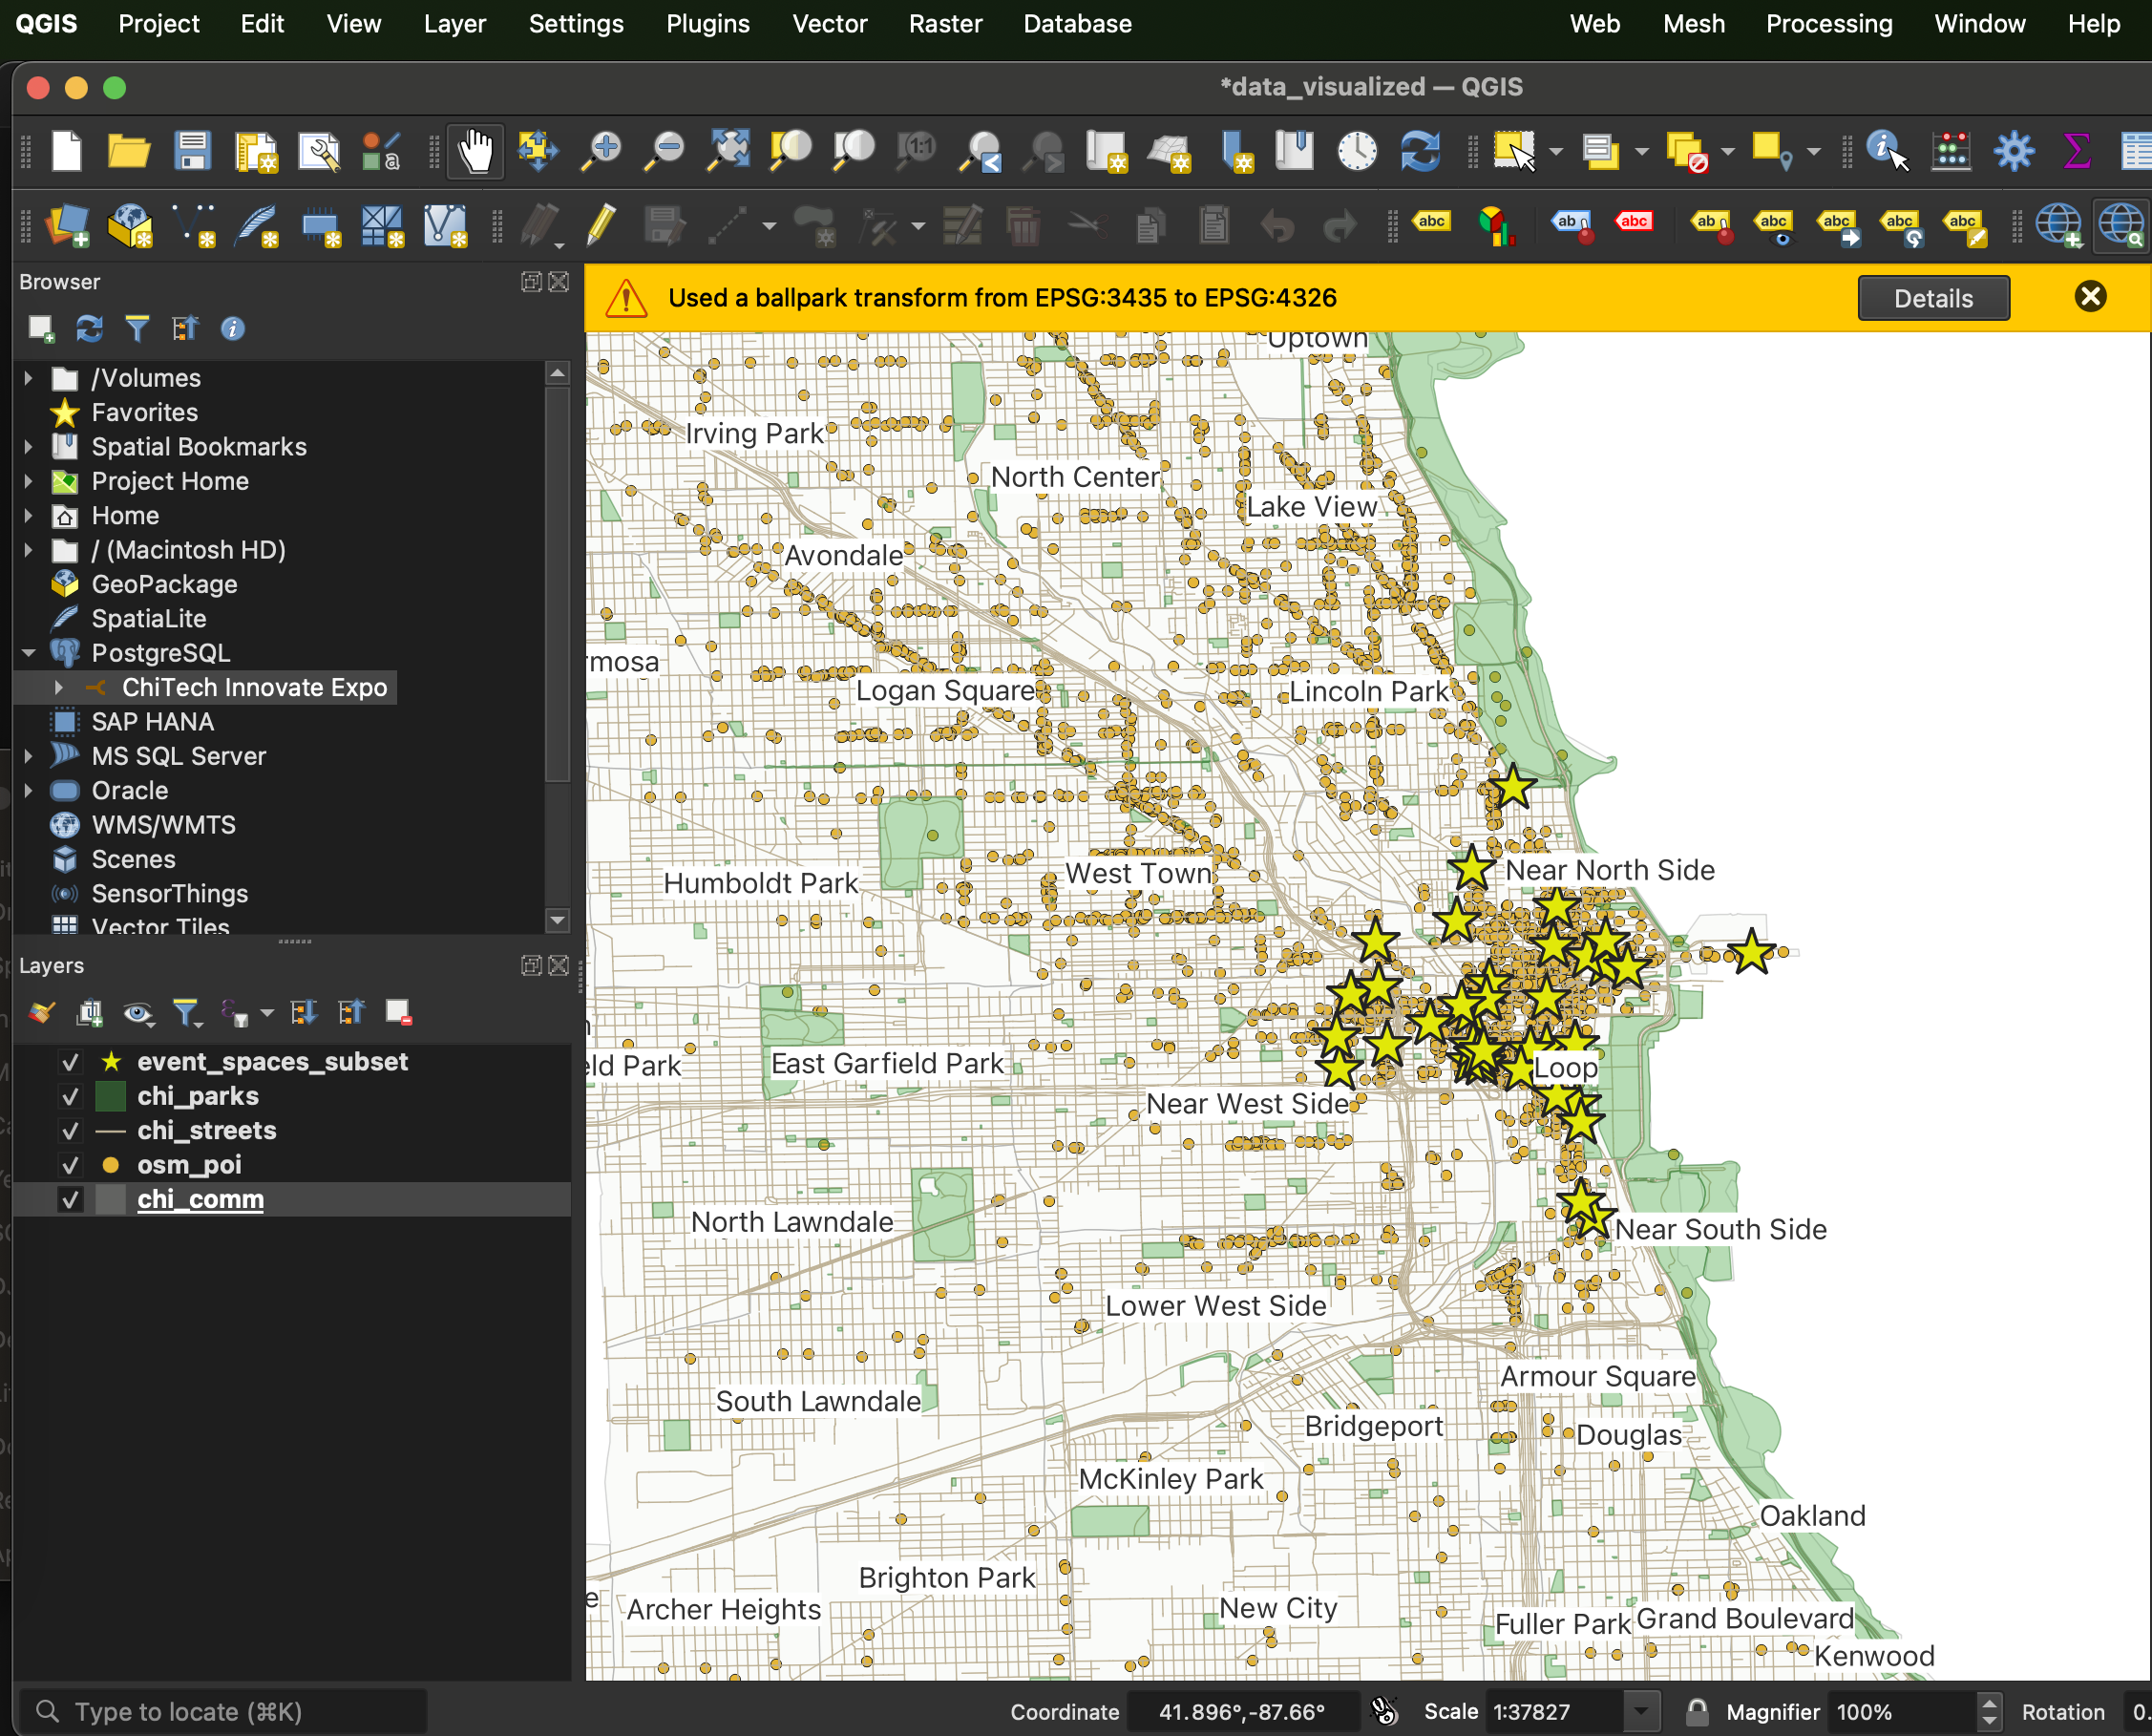
Visualized event, POI, shapefile data in QGIS
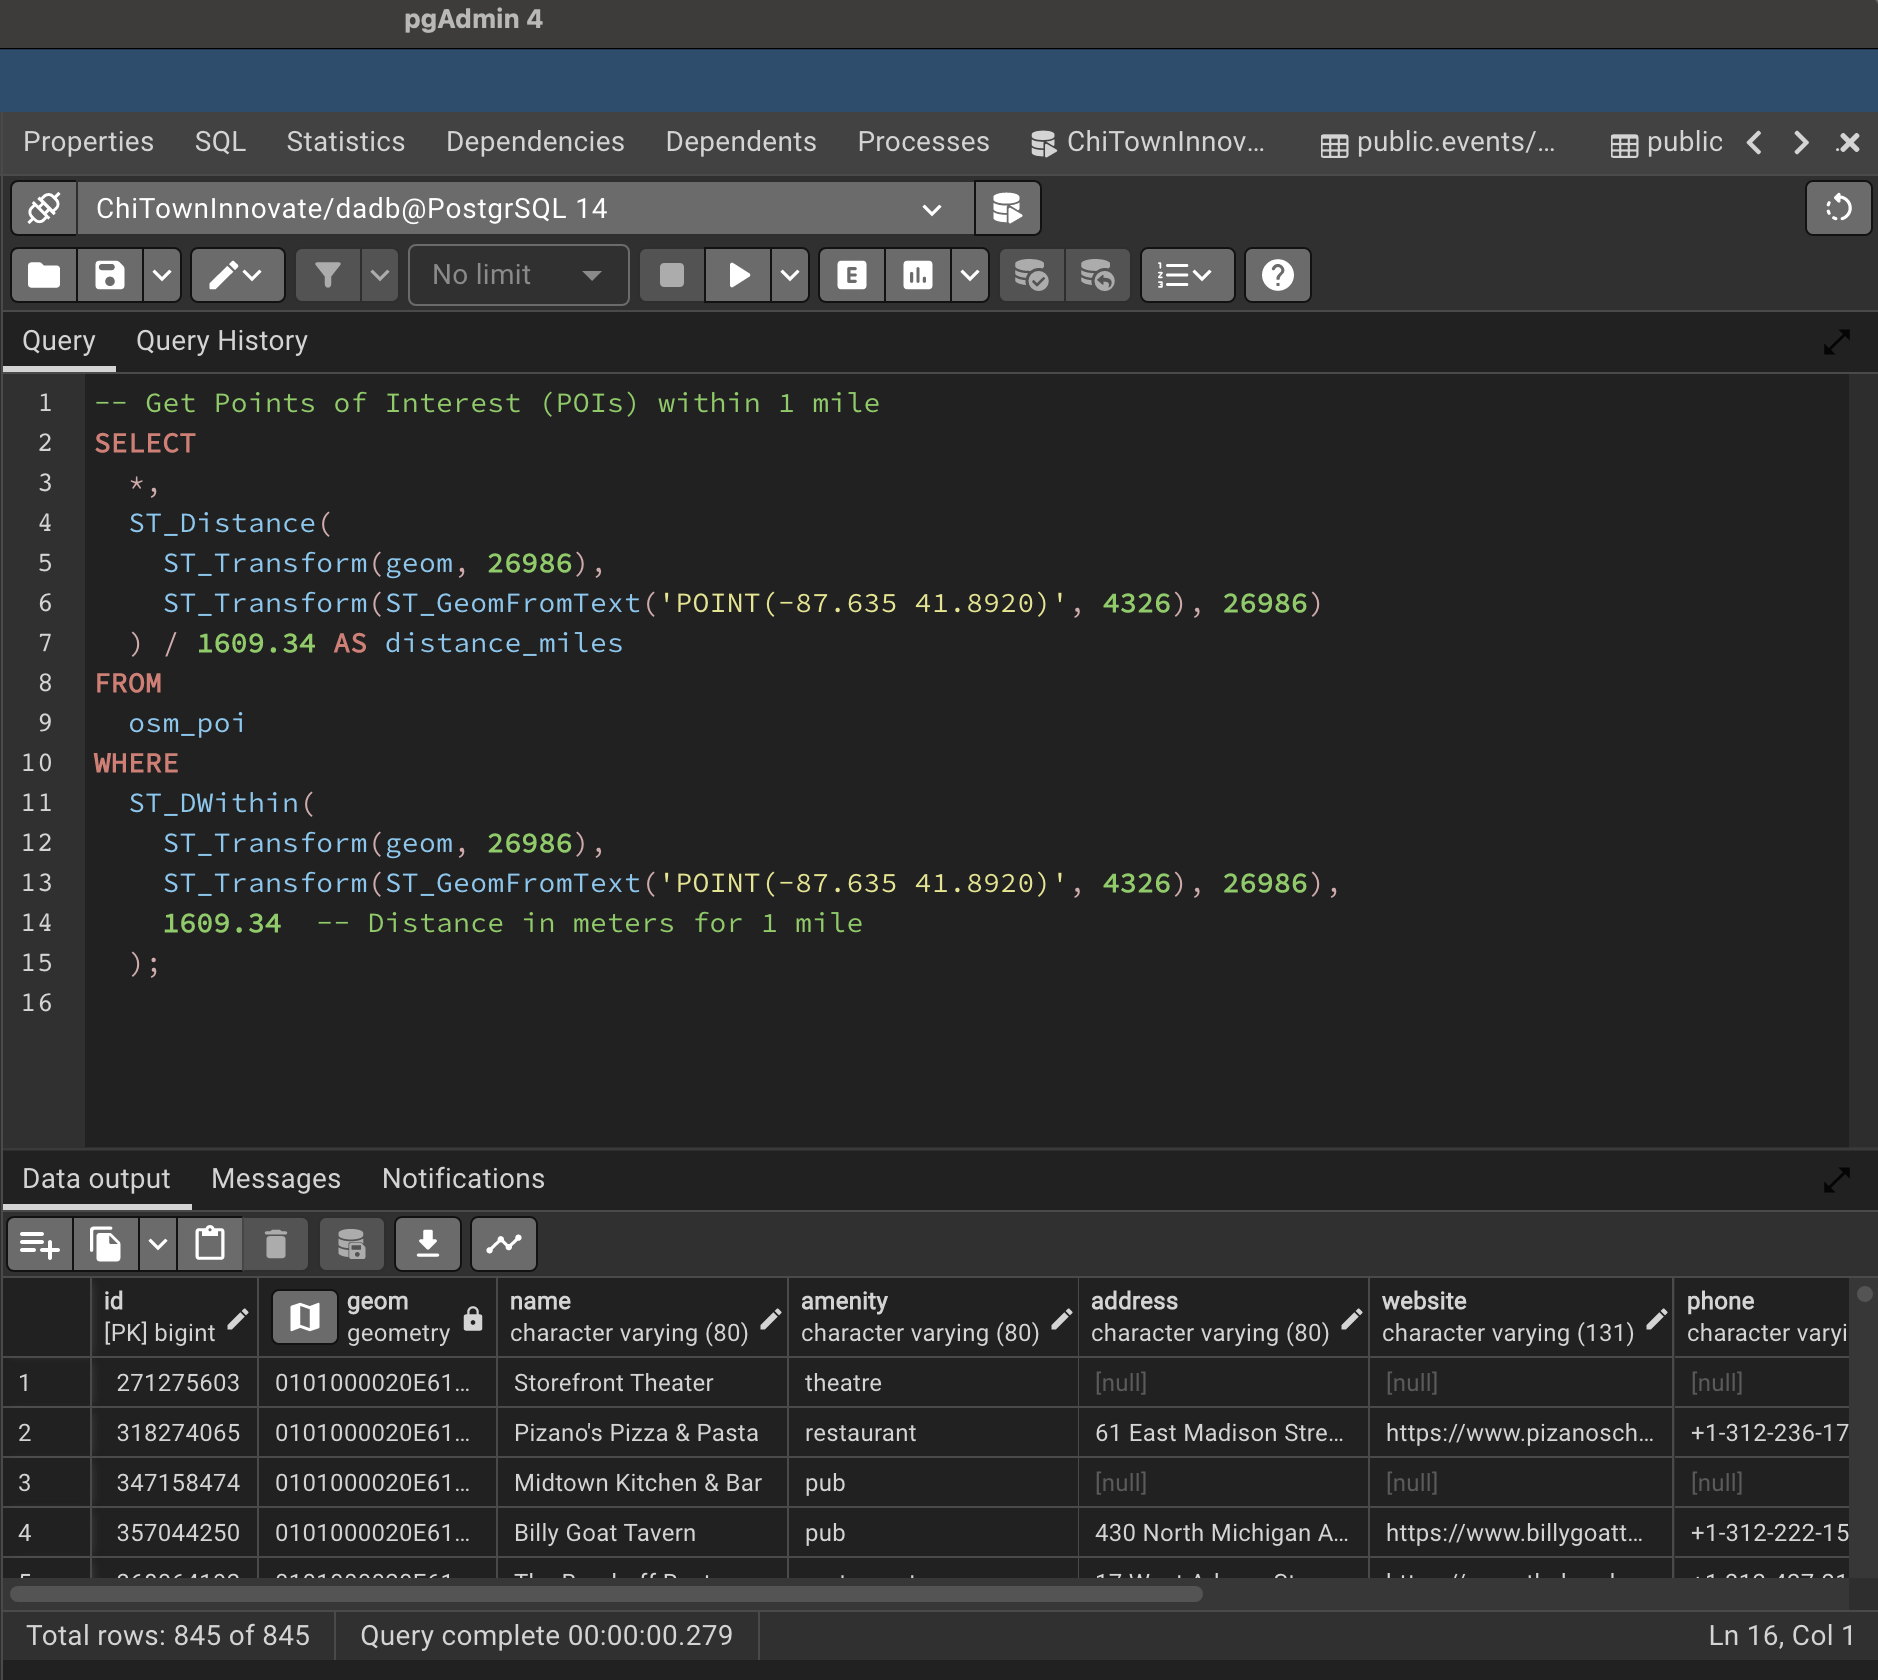
Wrote Spatial SQL code to query nearby POI, upcoming expo events and close by shapefiles
- In Python, used Psycog2 package to connect to local PostgreSQL database. After generating random user location/time, queried the following:
- Nearby Points of Interest (POI)
- Upcoming events, joined to the event venue data
- Nearby shapefiles
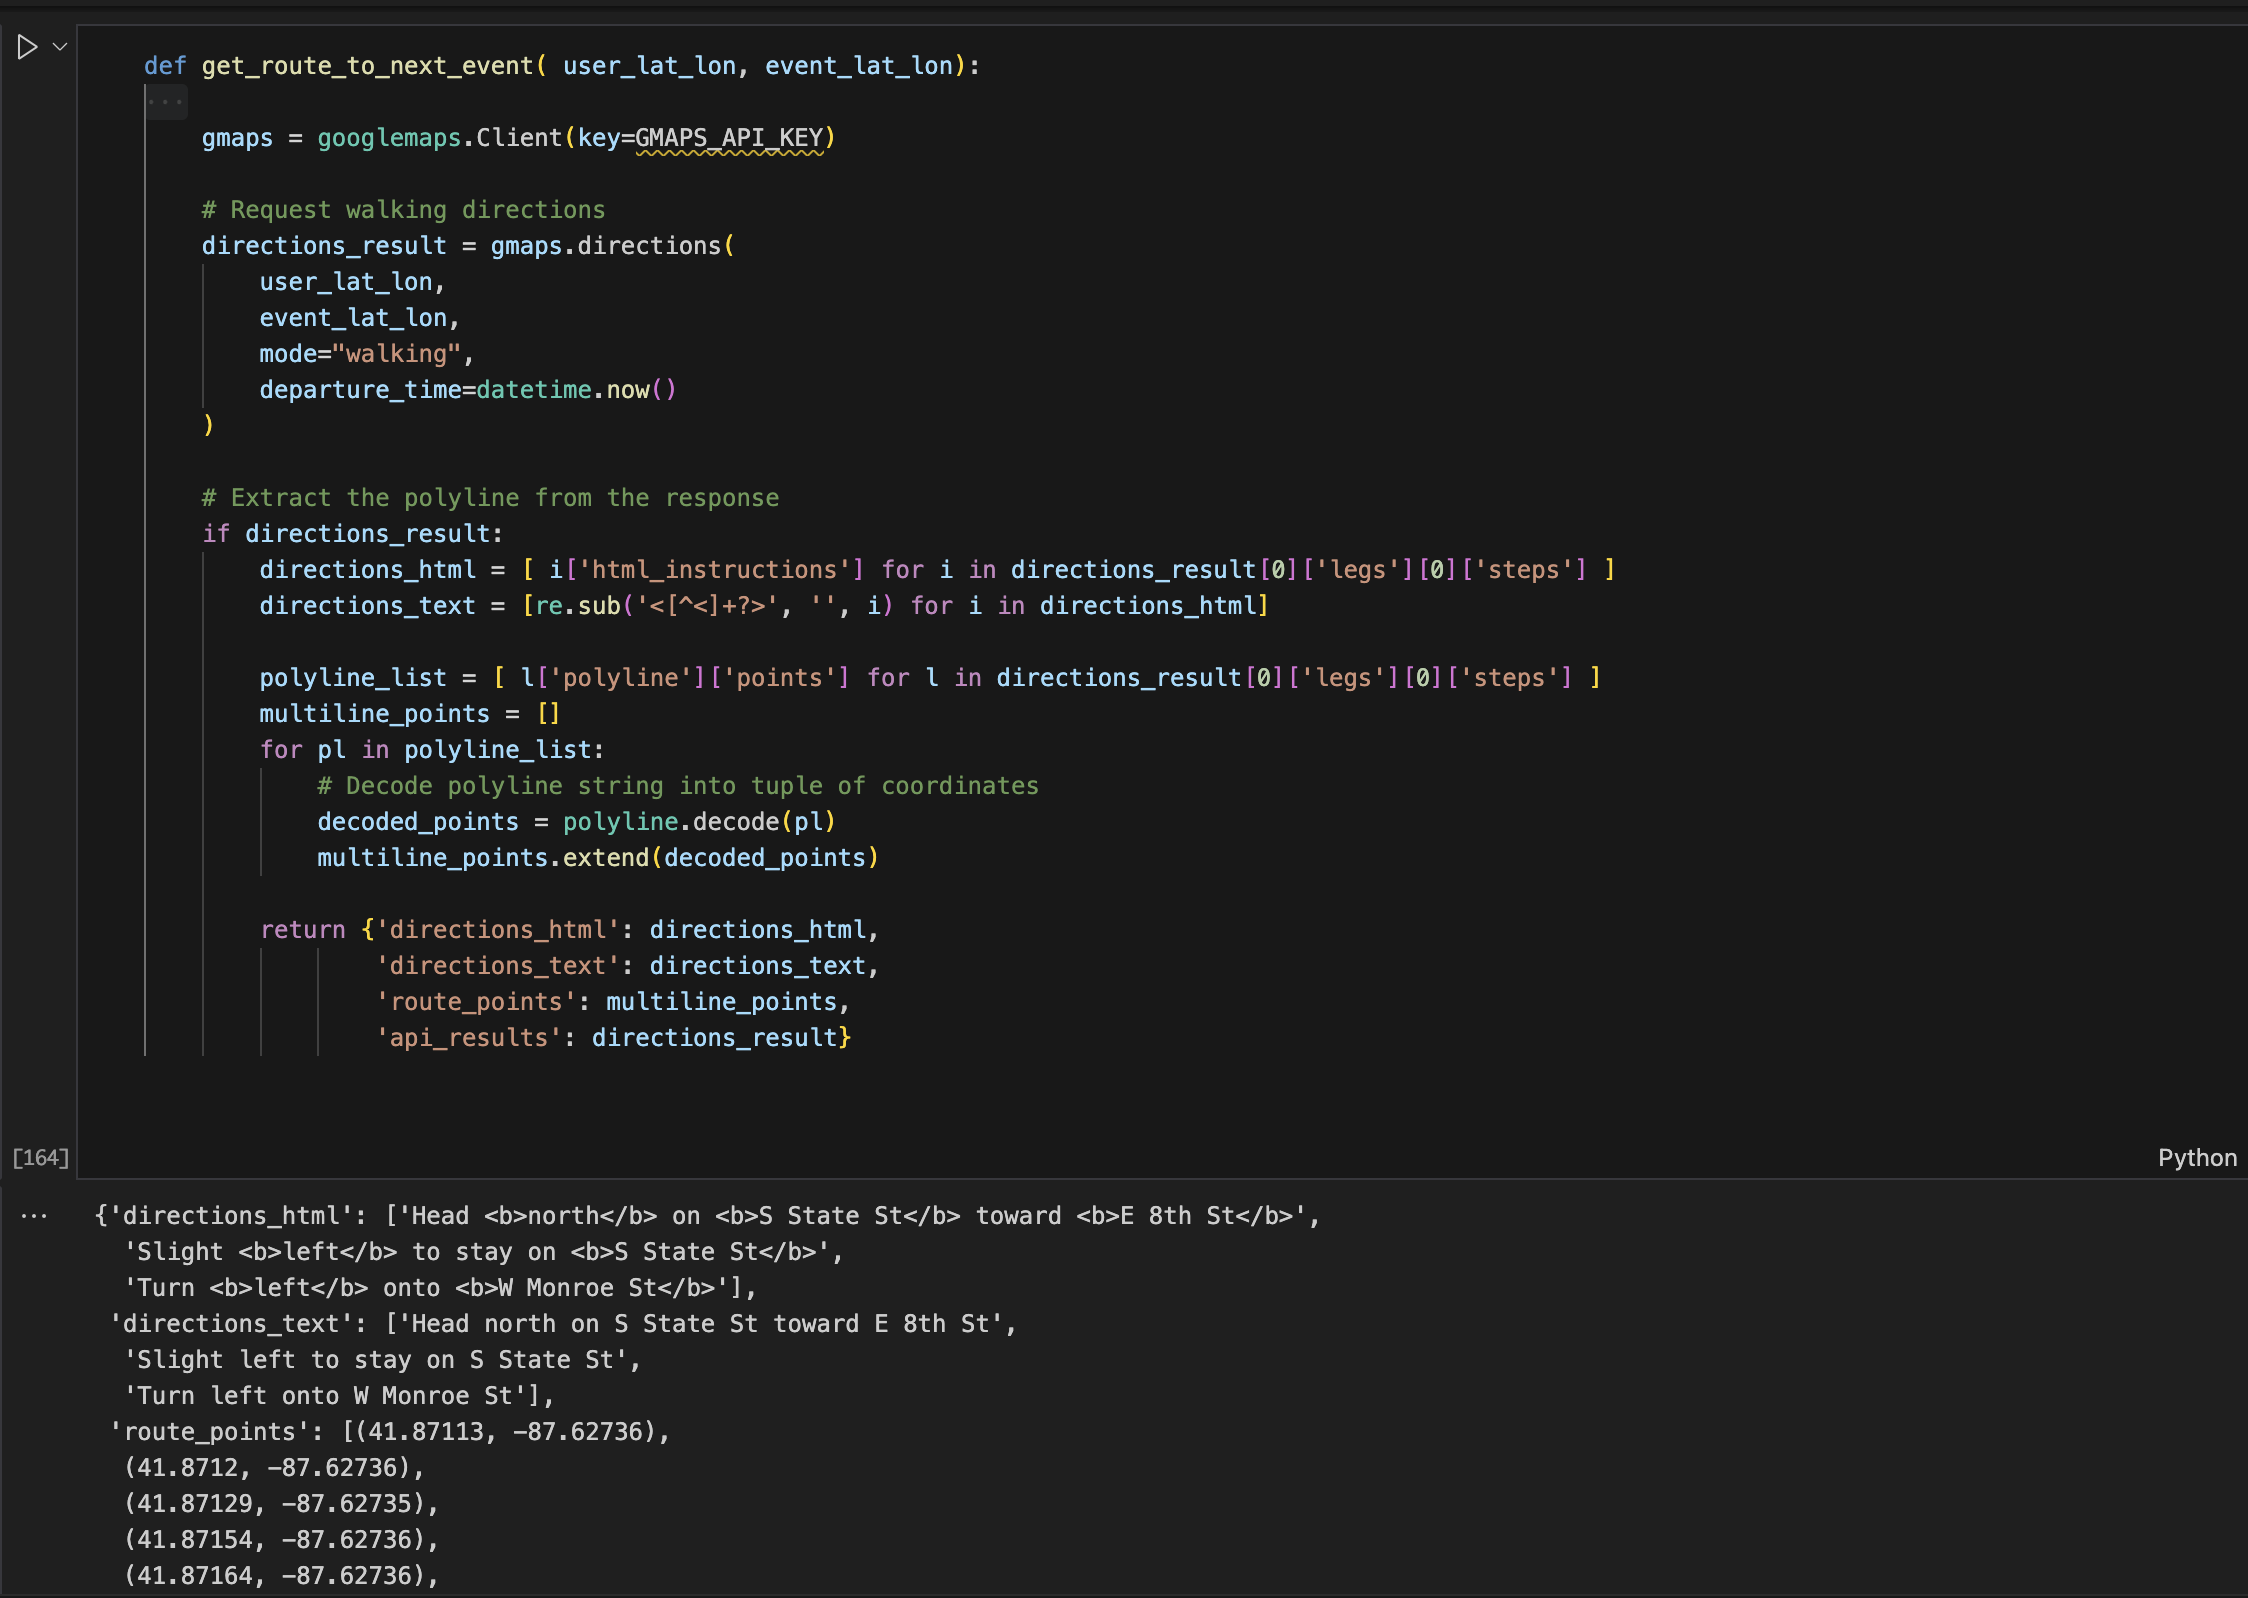
Set up Google Maps API and wrote code to compute walking directions between user location and next expo event
- Decoded google maps polystrings into multiline points for easier mapping
Used Folium to create interactive HTML maps
- Customized markers using html syntax and custom logos
- Customized popup displays using calculated information like distance, etc
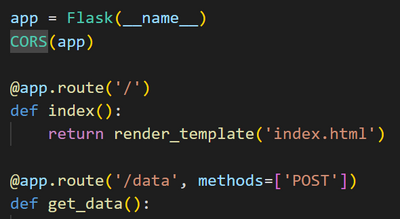
Used Flask to create a webapp for dynamic creation of maps
- Wrapped all querying, analysis, and mapping code in a python script
- Built a basic webpage using Janja2 and Flask to allow user to trigger the generation of a random location/time and the recompiling of the map
See example map:
Python Script to create map dynamically:
# import leaflet, pandas, geospatial packages
import folium
import pandas as pd
import geopandas as gpd
import os
import numpy as np
import matplotlib.pyplot as plt
import sys
import json
import requests

import osmnx as ox
import re
import time

import random
from datetime import datetime, timedelta
import base64

# Import packages to connect to postgres
from sqlalchemy import create_engine
from sqlalchemy_utils import database_exists, create_database
import psycopg2

import googlemaps
from folium.features import GeoJsonTooltip
from shapely.geometry import LineString, MultiLineString
import polyline
from shapely import wkt

# load config.py from ../utils/config.py
sys.path.append('utils')
sys.path.append('/Users/coltonlapp/Dropbox/My Mac (Coltons-MacBook-Pro.local)/Desktop/SCHOOL/Year2_Spring/Spatial DataScience/NearestPointOfInterest/code/utils')
from config import *


# create connection
def connect_to_db():
    # Use the variables in config.py to connect to the database
    dbname = DBNAME
    username = USERNAME
    # host is localhost
    host = HOST
    # password is your postgres password
    password = PGPASS

    # connect
    try:
        con = psycopg2.connect(database = dbname, user = username, host = host, password = password)
        return con
    except:
        print("Unable to connect to the database")
        return None
con = connect_to_db()

# Define parameters in a dictionary
chicago_params = {
    "min_lat": 41.8708,
    "max_lat": 41.8920,
    "min_lon": -87.635,
    "max_lon": -87.615,
    "start_datetime": datetime(2024, 9, 20, 17, 0),  # Friday 5pm
    "end_datetime": datetime(2024, 9, 22, 22, 0)     # Sunday 10pm
}


def get_random_location_time(params):
    # Generate a random latitude and longitude within the bounding box
    random_lat = random.uniform(params["min_lat"], params["max_lat"])
    random_lon = random.uniform(params["min_lon"], params["max_lon"])

    # Calculate the difference in seconds between the start and end datetimes
    time_difference = (params["end_datetime"] - params["start_datetime"]).total_seconds()

    # generate a time between 8am and 8pm using while loop
    while True:
        random_seconds = random.uniform(0, time_difference)
        random_datetime = params["start_datetime"] + timedelta(seconds=random_seconds)
        if random_datetime.hour >= 8 and random_datetime.hour < 20:
            break

    # Round time to nearest 15 minutes
    random_datetime = random_datetime - timedelta(minutes=random_datetime.minute % 15,
                                                  seconds=random_datetime.second,
                                                  microseconds=random_datetime.microsecond)

    # Create pandas df with random location and time
    random_data = pd.DataFrame({
        "datetime": [random_datetime],
        "lat": [random_lat],
        "lon": [random_lon]

    })

    # Turn into gdf
    user_time_location = gpd.GeoDataFrame(random_data, geometry=gpd.points_from_xy(random_data.lon, random_data.lat))

    return user_time_location


def return_close_POI(user_time_location, n_miles = 1, n_return = 10):

    osm_poi_table_name = 'osm_poi'

    # user point WKT
    point_wkt = user_time_location.geometry.iloc[0].wkt

    osm_query = f"""
        SELECT *,
            ST_Distance(ST_Transform(geom, 26986), ST_Transform(ST_GeomFromText('{point_wkt}', 4326), 26986)) / 1609.34 AS distance_miles
        FROM {osm_poi_table_name}
        WHERE ST_DWithin(ST_Transform(geom, 26986), ST_Transform(ST_GeomFromText('{point_wkt}', 4326), 26986), {n_miles} * 1609.34);
        """

    # Execute the query and load the results into a GeoDataFrame
    with con.cursor() as cursor:
        cursor.execute(osm_query)
        rows = cursor.fetchall()
        # Fetch the column names from the cursor
        colnames = [desc[0] for desc in cursor.description]
        # Create the GeoDataFrame using the fetched column names
        result_gdf = gpd.GeoDataFrame(rows, columns=colnames)

    # sort gdf by distance_miles
    result_gdf = result_gdf.sort_values(by='distance_miles')

    # return top n_return results
    #result_gdf = result_gdf.head(n_return)

    # Return random 10 subset
    result_gdf = result_gdf.sample(n_return)

    return result_gdf

# given users datetime, query database to get next events and venue information

def get_next_events(user_time_location, n_return = 5):

    events_table_name = 'events'
    venues_table_name = 'event_spaces_subset'

    # user point WKT
    point_wkt = user_time_location.geometry.iloc[0].wkt

    # Query to get n_return next events based off users time, and calculate distance to user. Join events and venues
    events_query  = f"""
    SELECT e.*, v.*,
        ST_Distance(ST_Transform (v.geom, 26986), ST_Transform(ST_GeomFromText('{point_wkt}', 4326), 26986)) / 1609.34 AS distance_miles
    FROM {events_table_name} e
    JOIN {venues_table_name} v ON e.venueid = v.id
    WHERE e.event_start > '{user_time_location.datetime.iloc[0]}'::timestamp AT TIME ZONE 'America/Chicago'
    ORDER BY e.starttime
    LIMIT {n_return};
    """

    # Execute the query and load the results into a GeoDataFrame
    with con.cursor() as cursor:
        cursor.execute(events_query)
        rows = cursor.fetchall()
        # Fetch the column names from the cursor
        colnames = [desc[0] for desc in cursor.description]
        # Create the GeoDataFrame using the fetched column names
        result_gdf = gpd.GeoDataFrame(rows, columns=colnames)

    # sort by event start time
    result_gdf = result_gdf.sort_values(by='event_start')

    return result_gdf


def get_parks_and_waterways(user_time_location, n_miles = 2):

    parks_table_name = 'chi_parks'
    waterways_table_name = 'Chi_water'

    # user point WKT
    point_wkt = user_time_location.geometry.iloc[0].wkt

    # query parks within 2 miles of user
    parks_query = f"""
                    SELECT
                        *,
                        ST_AsText(geom) AS geom_wkt,
                        ST_Distance(
                            ST_Transform(geom, 26986),
                            ST_Transform(ST_GeomFromText('{point_wkt}', 4326), 26986)
                        ) / 1609.34 AS distance_miles
                    FROM
                        {parks_table_name}
                    WHERE
                        ST_DWithin(
                            ST_Transform(geom, 26986),
                            ST_Transform(ST_GeomFromText('{point_wkt}', 4326), 26986),
                            2 * 1609.34
                        );
                    """


    # query waterways within 5 miles of user
    waterways_query =  f"""
                        SELECT
                            *,
                            ST_AsText(geom) AS geom_wkt,
                            ST_Distance(
                                ST_Transform(geom, 26986),
                                ST_Transform(ST_GeomFromText('{point_wkt}', 4326), 26986)
                            ) / 1609.34 AS distance_miles
                        FROM
                            {waterways_table_name}
                        WHERE
                            ST_DWithin(
                                ST_Transform(geom, 26986),
                                ST_Transform(ST_GeomFromText('{point_wkt}', 4326), 26986),
                                5 * 1609.34
                            );
                        """


    # Execute the query and load the results into a GeoDataFrame
    with con.cursor() as cursor:
        # Execute parks query and fetch data
        cursor.execute(parks_query)
        rows = cursor.fetchall()
        colnames = [desc[0] for desc in cursor.description]
        parks_df = pd.DataFrame(rows, columns=colnames)
        # Convert WKT in 'geom_wkt' to shapely Geometries
        if 'geom_wkt' in parks_df.columns:
            parks_df['geom'] = parks_df['geom_wkt'].apply(wkt.loads)
            parks_df.drop(columns=['geom_wkt'], inplace=True)  # Optional: remove the WKT column
        # Create GeoDataFrame
        parks_gdf = gpd.GeoDataFrame(parks_df, geometry='geom')

        # Execute waterways query and fetch data
        cursor.execute(waterways_query)
        rows = cursor.fetchall()
        colnames = [desc[0] for desc in cursor.description]
        waterways_df = pd.DataFrame(rows, columns=colnames)
        if 'geom_wkt' in waterways_df.columns:
            waterways_df['geom'] = waterways_df['geom_wkt'].apply(wkt.loads)
            waterways_df.drop(columns=['geom_wkt'], inplace=True)  # Optional: remove the WKT column
        # Create GeoDataFrame
        waterways_gdf = gpd.GeoDataFrame(waterways_df, geometry='geom')

    return parks_gdf, waterways_gdf

def get_comms():

    table_name = 'chi_comm'

    # query to get all community areas
    comm_query = f""" SELECT *, ST_AsText(geom) AS geom_wkt
                        FROM {table_name}
                        """

    # Execute the query and load the results into a GeoDataFrame
    with con.cursor() as cursor:
        cursor.execute(comm_query)
        rows = cursor.fetchall()
        colnames = [desc[0] for desc in cursor.description]
        comm_df = pd.DataFrame(rows, columns=colnames)
        if 'geom_wkt' in comm_df.columns:
            comm_df['geom'] = comm_df['geom_wkt'].apply(wkt.loads)
            comm_df.drop(columns=['geom_wkt'], inplace=True)  # Optional: remove the WKT column
        # Create GeoDataFrame
        comm_gdf = gpd.GeoDataFrame(comm_df, geometry='geom')

    return comm_gdf


def get_route_to_next_event( user_lat_lon, event_lat_lon):

    gmaps = googlemaps.Client(key=GMAPS_API_KEY)

    # Request walking directions
    directions_result = gmaps.directions(
        user_lat_lon,
        event_lat_lon,
        mode="walking",
        departure_time=datetime.now()
    )

    # Extract the polyline from the response
    if directions_result:
        directions_html = [ i['html_instructions'] for i in directions_result[0]['legs'][0]['steps'] ]
        directions_text = [re.sub('<[^<]+?>', '', i) for i in directions_html]

        polyline_list = [ l['polyline']['points'] for l in directions_result[0]['legs'][0]['steps'] ]
        multiline_points = []
        for pl in polyline_list:
            # Decode polyline string into tuple of coordinates
            decoded_points = polyline.decode(pl)
            multiline_points.extend(decoded_points)

        return {'directions_html': directions_html,
                'directions_text': directions_text,
                'route_points': multiline_points,
                'api_results': directions_result}


def get_div_icon_html(type, text_dict):

    if type=='user_location':
        # usage: text_dict['time'] = row['datetime'].strftime('%I:%M %p')
        html = """ <div style="position: relative; text-align: center; width: 70px;">
                    <div style="position: absolute; top: -10px; left: 0; width: 100%; font-weight: bold; font-family: Arial; color: black;">
                        User Location
                    </div>
                    <svg width="70" height="70">
                        <polygon points="35,5 41,25 55,25 45,35 50,55 35,45 20,55 25,35 15,25 29,25"
                            style="fill: yellow; stroke: black; stroke-width: 1;"/>
                        <text x="50%" y="65" text-anchor="middle" font-family="Arial" font-size="10" fill="black">Time: {} </text>
                    </svg>
                </div>
            """.format( text_dict['time'])

    elif type=='event':
        html = """
                <div style="position: relative; text-align: center; width: 100px;">
                    <img src="data:image/png;base64,{expo_logo_64}"  width="40" height="40" style="margin-top: 0px;"/>
                    <div style="position: absolute; top: 35px; left: 0; width: 100%; font-family: Arial;
                                color: black; text-shadow: 1px 1px 1px #fff; background-color: rgba(255, 255, 255, 0.3);">
                        {event_title} - {event_time}
                    </div>
                </div>
            """.format(expo_logo_64=text_dict['expo_logo_64'],
                       event_title=text_dict['event_title'] ,
                       event_time=text_dict['event_time'] )

    return html


# Create leaflet map of chicago with random location
def create_map():


    # Create a map centered on Chicago
    m = folium.Map(location=[41.8781, -87.6298], zoom_start=15, width='75%', height='75%')

    # ----------------- Add user location ----------------- #

    # Get random point in chicago and add to map
    user_time_location = get_random_location_time(chicago_params)

    # Add the random point to the map, with a popup saying "User location, time, lat/lon"
    for idx, row in user_time_location.iterrows():
        icon = folium.DivIcon(icon_anchor=(35, 34), html= get_div_icon_html( 'user_location', {'time' :row['datetime'].strftime('%I:%M %p') } ) )
        folium.Marker(location=[row["lat"], row["lon"]], icon=icon).add_to(m)


    # ----------------- Add nearby POI ----------------- #

    # get closest POI
    closest_poi = return_close_POI(user_time_location, n_return = 25)

    # keep max of 5 of each amenity type in closest poi
    for amenity_type in closest_poi['amenity'].unique():
        subset = closest_poi[closest_poi['amenity'] == amenity_type]
        closest_poi = closest_poi.drop(subset.index[5:])

    # Create a FeatureGroup to hold the POI markers
    feature_group = folium.FeatureGroup(name="Nearby Points of Interest")
    for amenity_type in closest_poi['amenity'].unique():
        subset = closest_poi[closest_poi['amenity'] == amenity_type]
        logo_path = os.path.join(LOGO_DIR, f'{amenity_type}.png')

        for idx, row in subset.iterrows():
            icon = folium.CustomIcon(icon_image=logo_path, icon_size=(30, 30))
            popup_content = f"{row['name']} - {row['amenity'].capitalize()}<br>{row['address']}<br>{row['distance_miles']:.2f} miles<br>{row['phone']}"
            popup = folium.Popup(popup_content, max_width=300)
            folium.Marker(location=[row["lat"], row["lon"]], icon=icon, popup=popup).add_to(feature_group)

    # Add the FeatureGroup to the map
    feature_group.add_to(m)


    # ----------------- Add upcoming Expo events ----------------- #

    # get next events
    events = get_next_events(user_time_location)

    # Encode the binary data in base64
    expo_logo_path = os.path.join(LOGO_DIR, 'expo_logo.png')
    with open(expo_logo_path, 'rb') as f:
        image_data = f.read()
    expo_logo_64 = base64.b64encode(image_data).decode('utf-8')

    # Add the events to the map
    labels = folium.FeatureGroup(name='Upcoming Expo Events')
    for idx, row in events.iterrows():
        icon = folium.DivIcon(icon_anchor=(50, 20),
                             html= get_div_icon_html( 'event', {'expo_logo_64': expo_logo_64,
                                                                'event_title' : row['eventtitle'],
                                                                'event_time' : row['event_start'].strftime('%I:%M %p') }) )
        folium.Marker(location=[row["lat"], row["lon"]],
                    icon=icon).add_to(labels)  # Add to the FeatureGroup
    labels.add_to(m)


    # ----------------- Add route to closest event ----------------- #

    # subset closest event

    if len(events) != 0:
        # get closest event after sorting events by distance_miles
        events = events.sort_values(by='distance_miles')
        closest_event = events.iloc[0]
        if len(closest_event) != 0:
            found_event = True
        event_lat_lon = (closest_event['lat'], closest_event['lon'])
        user_lat_lon = (user_time_location.loc[0, 'lat'], user_time_location.loc[0, 'lon'])

        # Get route to closest event
        directions_result = get_route_to_next_event(user_lat_lon, event_lat_lon)

        # Add the route to the map
        labels = folium.FeatureGroup(name='Route to Closest Event')
        folium.PolyLine(directions_result['route_points'], color="blue", weight=2.5, opacity=1).add_to(m)
        labels.add_to(m)
    else:
        found_event = False
        directions_result = None
        closest_event = None


    # ----------------- Add Chicago Parks and waterways ----------------- #

    parks_gdf, waterways_gdf = get_parks_and_waterways(user_time_location)

    # Create a FeatureGroup to hold the park polygons
    feature_group = folium.FeatureGroup(name="Chicago Parks")
    # add parks as green fill no outline with on hover popup of "label" column
    for idx, row in parks_gdf.iterrows():
        folium.GeoJson(
            data=row['geom'],
            style_function=lambda x: {'fillColor': 'green', 'fillOpacity': 0.3, 'color': 'none'},  # Set outline color to 'none'
            highlight_function=lambda x: {'weight': 3, 'fillOpacity': 0.5}, tooltip=row['label']).add_to(feature_group)

    # Add the FeatureGroup to the map
    feature_group.add_to(m)

    # Create a FeatureGroup to hold the waterway lines
    feature_group = folium.FeatureGroup(name="Chicago Waterways")
    # add waterways as blue lines with on hover popup of "label" column
    for idx, row in waterways_gdf.iterrows():
        folium.GeoJson(
            data=row['geom'],
            style_function=lambda x: {'fillColor': 'blue', 'fillOpacity': 0.2, 'color': 'none'},
            highlight_function=lambda x: {'weight': 1, 'color': 'blue'}, tooltip=row['name']).add_to(feature_group)

    # Add the FeatureGroup to the map
    feature_group.add_to(m)


    # ----------------- Get Closest Comm ----------------- #

    comm_gdf = get_comms()
    closest_comm = comm_gdf.loc[comm_gdf.distance(user_time_location.geometry.iloc[0]).idxmin(), 'distitle']


    # ----------------- Finalize Map ----------------- #

    folium.TileLayer('CartoDB positron', name='Minimal Base Map').add_to(m)
    folium.LayerControl().add_to(m)

    # fit bounds to 1 mile buffer of user location
    m.fit_bounds([ [user_time_location['lat'].iloc[0] - 0.01, user_time_location['lon'].iloc[0] - 0.01],
                   [user_time_location['lat'].iloc[0] + 0.01, user_time_location['lon'].iloc[0] + 0.01] ])


    # save map to templates/map.html
    try:
        m.save('templates/map.html')
    except:
        pass
    try:
        m.save('/Users/coltonlapp/Dropbox/My Mac (Coltons-MacBook-Pro.local)/Desktop/SCHOOL/Year2_Spring/Spatial DataScience/NearestPointOfInterest/code/templates/map.html')
    except:
        pass

    # create dict to return all info
    out_dict = {'map': m,
         'random_time': user_time_location['datetime'].iloc[0].strftime('%I:%M %p'),
         'random_date': user_time_location['datetime'].iloc[0].strftime('%m/%d/%Y'),
         'random_coords': "(" +str( round(user_time_location['lat'].iloc[0], 4)) + ', ' + str(round(user_time_location['lon'].iloc[0], 4)) + ")",
         'closest_event_location' : closest_event['name'] if found_event else None,
         'closest_event_name': closest_event['eventtitle'] if found_event else None,
         'closest_event_desc' : closest_event['eventdescription'] if found_event else None,
         'closest_event_time' : closest_event['event_start'].strftime('%I:%M %p') if found_event else None,
         'closest_event_date' : closest_event['event_start'].strftime('%m/%d/%Y') if found_event else None,
         'closest_event': closest_event if found_event else None,
         'directions_result': directions_result if found_event else None,
         'directions_html': directions_result['directions_html'] if found_event else [None, None],
         'closest_comm': closest_comm}

    return out_dict

if __name__ == 'main':
    create_map()
    print('Map created successfully!')

create_map()